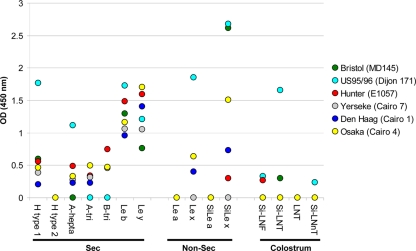
Fig. 4.
Binding of the GII.4 variant VLPs to a panel of neoglycoconjugates. The binding experiments were performed in duplicate for each HSA glycoconjugate, and the mean values are plotted on the graph. Ordinate and abscissa indicate the OD at 450 nm and the nature and the origin of the oligosaccharide moiety, respectively. Details about the neoglycoconjugates are shown in Table 3. Variants are identified by the legend at right, with the name of the isolate in parentheses.

