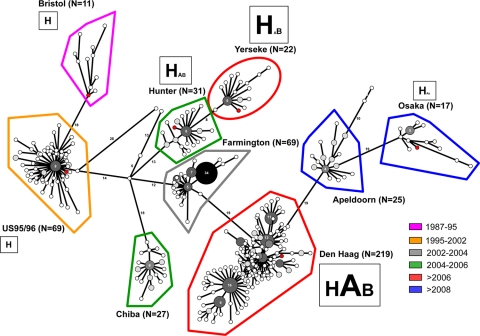
Fig. 6.
MST of the GII.4 variants. The number of sequences for each group of variants is indicated in parentheses. Identical sequences are represented by gray-shaded circles, which are scaled according to member count. The white and light gray circles represent one and two sequences, respectively. For dark gray and black circles, the number of identical sequences is indicated inside each circle. The six GII.4 isolates, which were analyzed during the study, are indicated by red circles. Each group of variants is color coded according to the date of circulation, as described previously (2). For the six variants that were analyzed, the binding profile to secretor and nonsecretor HBGAs is summarized in Table 4. For the A, B, and H antigens, the size of the letter is scaled according to the numbers of RU that were determined during the SPR analysis in the experiment shown in Fig. 5.

