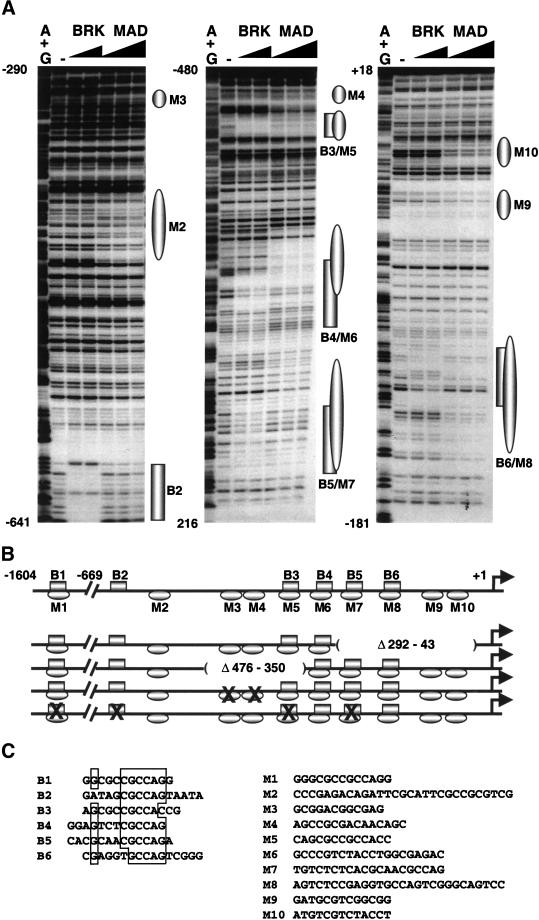
Figure 3.
Mad and Brk bind to the zen promoter. (A) DNase I footprinting analysis of Mad and Brk GST fusion proteins bound to the proximal 669 bp of the zen promoter. Increasing amounts of Brk (50 ng and 150 ng) and Mad (500 ng, 1500 ng, and 4500 ng) were incubated with zen-promoter DNA fragments: (left panel) EcoRI–AccI fragment labeled at the EcoRI site (−669 to −290), (middle panel) XbaI–AvaI fragment labeled at the XbaI site (−198 to −480), (right panel) XbaI–BamHI fragment labeled at the XbaI site (−198 to +18). The numbers correspond to the positions of the nucleotides relative to the transcription start site (+1). The (−) lanes show DNase I digestion of the DNA probes. The G+A lanes show the chemical degradation of the probes on G+As. Regions protected by Mad and Brk proteins are depicted as ovals and rectangles, respectively. (B) Schematic representation of the Smad (Mad/Medea) and Brk binding sites on the 1604-bp zen promoter, and the deletion and point mutations used in the transgenic analysis. The drawing is in scale only for the proximal 669 bp of the promoter. The locations of Brk binding sites (B2–B6) and Mad sites (M2–M10) are based on the footprinting data. The location of B1/M1 and all of the Medea sites were found by gel-shift analysis (not shown). The deletions are designated as absent lines inside parentheses, and the binding sites with point mutations are designated by X. (C) Alignment of the sequences of the BRK binding sites (B1–B6) (left). A list of Mad/Medea sites that cannot be aligned because of their degeneracy (right). Note that none of the Mad/Medea sites contains the inverted repeat 5′-GTC TAGAC-3′, which was determined as an optimal site for Smad3 and Smad4 proteins (Zawel et al. 1998).

