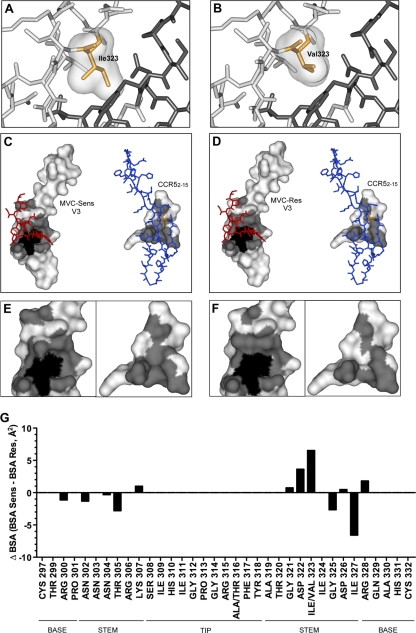
Fig. 6.
Analysis of MVC resistance mutations in the context of the V3-CCR52–15 sulfopeptide protein interface. (A and B) Close-up views of the V3-CCR52–15 binding sites of the MVC-Sens (A) and MVC-Res (B) Envs, with V3 loops (light gray) and the CCR52–15 sulfopeptide (dark gray) shown as stick models. Ile323 of MVC-Sens V3 and Val323 of MVC-Res V3 are shown as orange stick models with molecular surfaces in gray. (C) The molecular surface of MVC-Sens V3 (left) in complex with the CCR52–15 sulfopeptide (red stick model) and the molecular surface of the CCR52–15 peptide (right) in complex with the V3 loop (blue stick model) are shown in white, with the interface area in gray. The molecular surfaces of buried residues (less than 10.00% solvent-accessible surface) are shaded black. (D) The molecular surfaces of MVC-Res V3 (left) and the CCR52–15 sulfopeptide (right) are colored as in panel C. Ile323 and Val323 in the stick models of the MVC-Sens and MVC-Res V3 loops are colored orange. (E and F) Close-up views of panels C and D, respectively, without the stick models. (G) The change in the buried surface area (ΔBSA, expressed in Å2) between the MVC-Sens and MVC-Res Envs at individual residue positions in the V3 loop was calculated as described in Materials and Methods and was plotted using Prism, version 5.0a (GraphPad Software). Residues corresponding to the V3 loop base, stem, and tip were identified according to the work of Xiang et al. (78).

