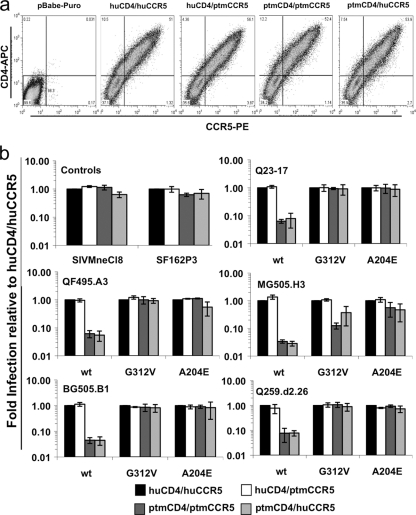
Fig. 6.
(a) Transient expression of human and Ptm CD4 and CCR5 in 293T cells. The y axis represents CD4 expression, and the x axis represents CCR5 expression as determined by flow cytometry. The CD4/CCR5 combination is denoted at the top of each plot, and pBabe-puro denotes cells transfected with the empty pBabe-puro vector. These plots are representative of three replicate experiments. (b) Single-cycle infection of 293T cells expressing human versus Ptm CD4 and CCR5 with GFP reporter pseudoviruses bearing wild-type subtype A Envs and G312V and A204E variants. The y axis represents viral infection relative to the huCD4/huCCR5 combination, which was set to 1 for reference. The name of the parental virus is indicated at the top of each plot, and the amino acid change is indicated on the x axis (wt refers to the wild-type Env variant). In general 20 to 300 GFP-positive cells were enumerated per well, depending on the dilution, the virus, and the CD4/CCR5 pair. No GFP-positive cells were observed when cells were infected with Env(−) pseudoviruses (data not shown). Three replicates were performed and each replicate included all of the receptor pairings, with the exception of one in which the ptmCD4/huCCR5 pair was not included. The final replicate experiment for the ptmCD4/huCCR5 pair was later performed in a separate experiment. The error bars represent the standard deviations of the means from all of the data amassed in the replicate experiments.

