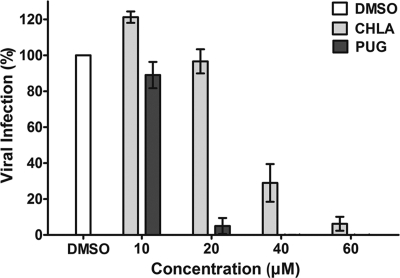
Fig. 2.
Dose response for inhibition of HSV-1 infection in A549 cells by CHLA and PUG. A549 cells were seeded into 96-well plates and then infected with HSV-1-GFP (MOI = 1) in the presence or absence of the tannins at various concentrations (0, 10, 20, 40, and 60 μM) for 24 h. DMSO (0.1%) served as a negative control. Viral infection was quantified by measuring GFP fluorescence using a Typhoon 9410 variable mode imager. The data shown are means ± the standard errors of the mean (SEM) of three independent experiments, with each tannin treatment being performed in triplicate.

