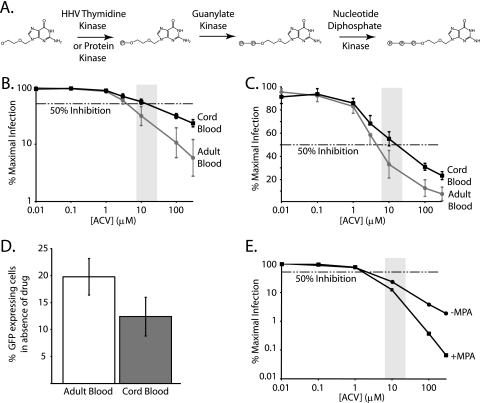
Fig. 1.
Acyclovir is an anti-HIV-1 drug. (A) Enzymes that phosphorylate acyclovir to the active 5′-triphosphate form in HHV-infected cells. Shown is the prodrug acyclovir, a herpesvirus-specific nucleoside analog. The first phosphate is added to a hydroxyl that is structurally analogous to the 5′ end of a nucleoside. In HHV-infected cells, this reaction is carried out by a herpesvirus-encoded TK or protein kinase. The monophosphate is retained in the cell, and the second and third phosphates are sequentially added by the indicated cellular enzymes. (B) Acyclovir inhibits HIV-1 replication in a single-round infectivity assay using CD4+ T lymphoblasts from healthy adult peripheral blood and cord blood. Activated CD4+ T cells isolated from healthy adult or cord blood were infected with an HIV-1 pseudovirus in the presence of increasing concentrations of acyclovir. Dose response curves for adult (gray line and circle) and cord (black line and square) cells are plotted as percentages of maximal infection, defined for each cell type as the number of GFP-expressing cells in the presence of the drug divided by the number of GFP-expressing cells in the absence of a drug effect on a log-log graph. Error bars represent the standard errors of the means of the data from three replicate experiments with cells from six separate healthy or cord blood donors. The dashed horizontal line represents 50% inhibition. The lightly shaded box represents the peak clinical concentration range of acyclovir, with peak plasma concentrations ranging from 7 μM to 26.6 μM, depending on the form and dose. (C) Traditional semilog representation of data from panel B. The dose response curve was plotted from the same data as for panel B, graphed on a different scale to emphasize the anti-HIV activity of acyclovir at clinical concentrations. (D) Comparison of infectibilities of cord and adult cells. Bar graphs for adult (white) and cord (dark gray) cells represent the average percentages of GFP-expressing cells with infection in the absence of the drug, using the same number of viral particles per number of cells. The amounts of virus added for infection were equivalent for both adult and cord blood and were determined by a viral titration curve in adult cells. The volume of virus that yielded approximately 20% GFP-expressing cells was used for the dose response curves. (E) MPA enhances the anti-HIV activity of acyclovir. Acyclovir dose response curves generated in the absence (circle) or presence (square) of 5 μg/ml MPA as for panel A. In the absence of acyclovir, the levels of infection were the same in wells with and without MPA. ACV, acyclovir.

