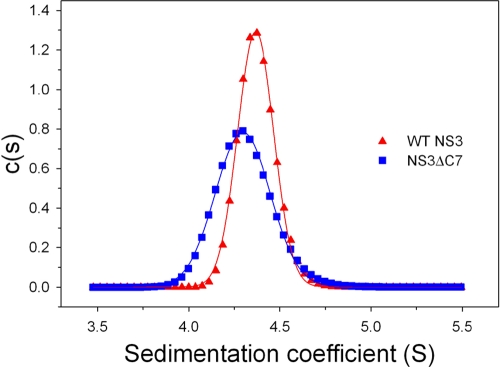
Fig. 3.
Hydrodynamic analysis using sedimentation velocity. Shown is the calculated distribution c(s) versus S of WT NS3 (triangles) and NS3ΔC7 (squares). Data were acquired at a protein concentration of 5 μM, a rotor temperature of 25°C, and a rotor speed of 42,000 rpm. The sedimentation coefficients were 4.4S for WT NS3 and 4.3S for NS3ΔC7.

