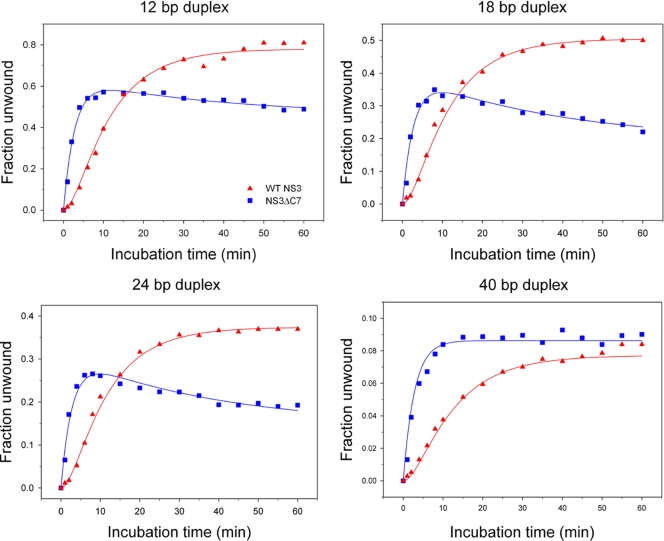
Fig. 4.
Functional complex formation on RNA duplexes. The fraction of RNA duplex unwound versus incubation time is plotted for WT NS3 (triangles) and NS3ΔC7 (squares). The four RNA substrates were 12, 18, 24, or 40 bp in length and contained an 18-nt, single-stranded 3′ overhang. Continuous curves represent the results of global fitting of the data using the reaction schemes described in Materials and Methods. Best fits for WT data yielded k1 = 0.1 ± 0.01 min−1 and k2 = 0.35 ± 0.06 min−1. Best fits for NS3ΔC7 data yielded k2 = 0.36 ± 0.02 min−1 and k3 = 0.03 ± 0.01 min−1.

