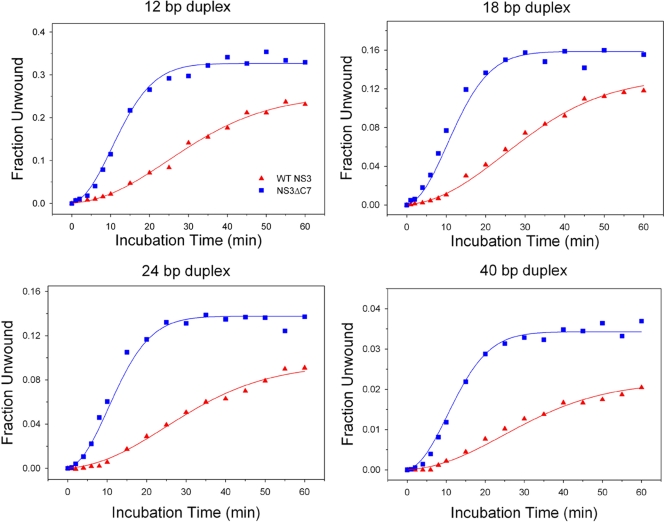
Fig. 6.
Functional complex formation in the presence of 15% glycerol. The concentration of glycerol in the reaction conditions was increased from 1% to 15%. Continuous curves represent the results of global fitting of the data for WT NS3 (triangles) and NS3ΔC7 (squares) to equation 3 as described in Materials and Methods. Best fits for WT data yielded n = 2.5 ± 0.2 and k = 0.072 ± 0.01 min−1. Best fits for NS3ΔC7 data yielded n = 2.9 ± 0.2 and k = 0.22 ± 0.003 min−1. In these experiments, the value of “n” is not implied to have a specific physical meaning and is a mathematical consequence of the hyperbolic shape of these particular curves. Note that values for n are approximately 3 in all of these experiments (including those in Fig. 7), but values for k vary greatly. Given that n remains approximately the same, we suggest that variations in k provide a direct means for comparison between the proteins. It is therefore most significant that the rate constant for NS3ΔC7 vastly exceeds that of the WT under all these conditions.

