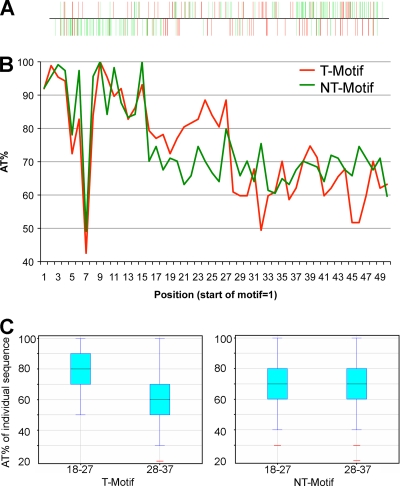
Fig. 5.
AT frequency following the core motif correlates with transcription. (A) Distribution of the 318 core motifs on the VACV genome (P < 0.0001 by the FIMO program). The motifs with no or only one TSS count were colored red, and the ones with more than one count were colored green. (B) Incidence of A and T at each position 50 nt downstream of the T-motif and NT-motif. (C) Box-and-whisker plots of AT frequency of the 10 nt from positions 18 to 27 and positions 28 to 37 of individual T-motifs and NT-motifs, respectively. In the box-and-whisker plots, the first and third quartiles are indicated by the bottom and top of the box, respectively. The median is indicated by the line in the middle of the box. The “whiskers” extend to the farthest points that are within 1.5 times the interquartile range.

