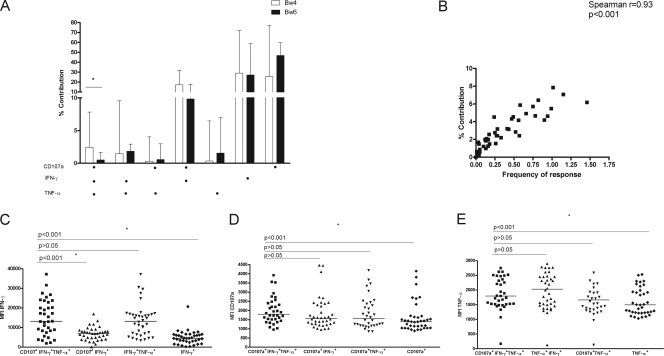
Fig. 1.
Stimulated NK cells from KIR3DL1 (3DL1) homozygous HIV-infected slow progressors (SP) have higher trifunctional activity when from carriers of an HLA-Bw4 allele than from Bw6 homozygotes (hmz). (A) Comparisons of percent contributions of seven functional profiles to the total NK response by NK cells from 3DL1 hmz SP stimulated with K562. Results for 40 SP carrying at least one Bw4 allele were compared to those for 7 Bw6 hmz. Dots below the x axis refer to the presence of a measured functional marker (CD107a, IFN-γ, and TNF-α). Bar heights refer to the median percent contribution of that functional subset to the total NK response for the group. Error bars refer to the upper range for the group. Significant between-group differences are shown with an asterisk over the line linking the two bars representing the groups being compared. (B) Correlation of results reported as the percent contribution of the trifunctional (CD107a+ IFN-γ+ TNF-α+) NK subset to the total NK response with results reported as the frequency of this functional NK subset for the 47 SP subjects in panel A. A Spearman's correlation test was used to test the significance of these two ways of reporting results. (C) Comparisons of the mean fluorescence intensities (MFI) of IFN-γ secretion are plotted on the y axis for trifunctional (CD107a+ IFN-γ+ TNF-α+), bifunctional (CD107a+ IFN-γ+ and IFN-γ+ TNF-α+), and monofunctional IFN-γ+ NK cells. Panel D shows the MFI of TNF-α secretion plotted on the y axis for trifunctional (CD107a+ IFN-γ+ TNF-α+), bifunctional (CD107a+ TNF-α+ and IFN-γ+ TNF-α+), and monofunctional TNF-α+ NK cells. Panel E shows the MFI of CD107a expression plotted on the y axis for trifunctional (CD107a+ IFN-γ+ TNF-α+), bifunctional (CD107a+ TNF-α+ and CD107a+ IFN-γ+), and monofunctional CD107a+ NK cells. For panels C, D, and E, the line through the scatter plots represents the median. Mann-Whitney U tests were used to test the significance of between-group comparisons. P values for these are shown above the lines linking two bars representing functional subsets.

