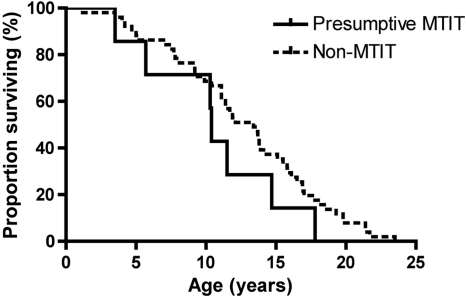
Fig. 3.
Mortality is not affected by mode of SIV transmission. Kaplan-Meier survival curves are shown for SMs infected with SIV by presumptive MTIT (n = 7; filled line) and SMs infected with SIV by non-MTIT (n = 51; dashed line). The mortality rates of the two groups do not differ significantly (P = 0.22). The proportion of surviving SMs is shown in relation to their age in years.

