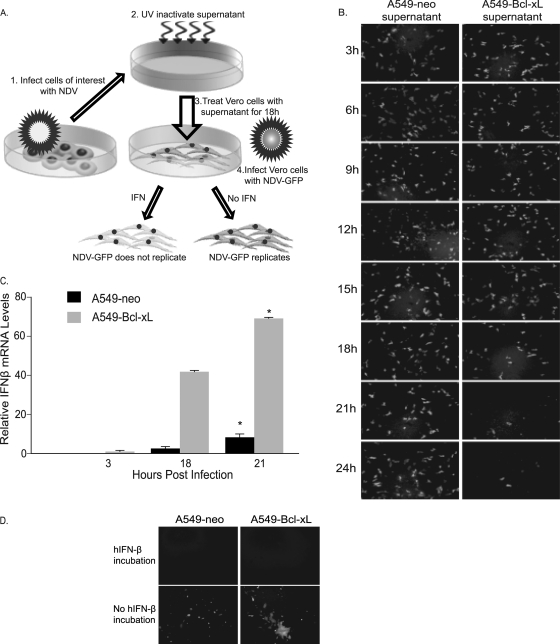
Fig. 6.
NDV activates the type I IFN response in both A549-neo and A549–Bcl-xL cells. (A) Schematic diagram of the bioassay for IFN production. Briefly, A549-neo and A549–Bcl-xL cells were infected with NDV at an MOI of 0.1, supernatants were collected at appropriate time points, and then any virus present was UV inactivated. Fresh Vero cells were treated with the inactivated supernatants and then infected with NDV (B1)-GFP at an MOI of 1. (B) Antiviral activity in A549-neo and A549–Bcl-xL cells after NDV infection. Supernatants were collected every 3 h after infection and used in IFN bioassays. (C) hIFN-β mRNA levels in NDV-infected A549-neo and A549–Bcl-xL cells relative to those in noninfected cells measured by qRT-PCR at 3, 18. and 21 hpi. *, P < 0.03. (D) A549-neo and A549–Bcl-xL cells were incubated with medium containing 1,000 U of hIFN-β. After 18 h of incubation, cells were washed and infected with NDV (LS)-GFP at an MOI of 0.01 and the GFP signal was assessed at 48 h.

