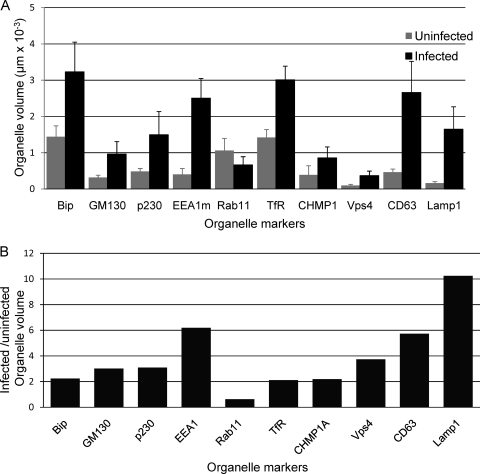
Fig. 6.
Organelle volumes in uninfected and infected cells. (A) The “Find Objects” algorithm from the Volocity software package was used to identify objects in three-dimensional reconstructions that correspond to objects visible in images such as those shown in Fig. 2 and 3. The net intracellular volume associated with these objects was obtained by summing the volumes of the positive voxels. For EEA1, results were from staining with the mouse MAb. Mean values are expressed (±standard errors of the means). (B) Ratios of organelle volumes in infected cells compared to those in uninfected cells.

