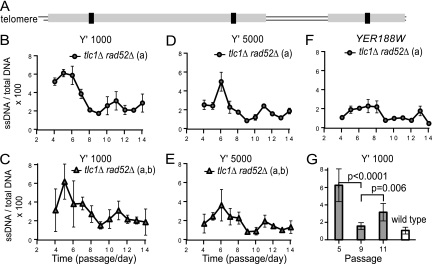
Fig. 1.
Dynamics of ssDNA during replicative senescence. (A) Cartoon representing the right arm of chromosome V. (B to G) To ensure a sufficient number of senescent cells, each of three independently generated tlc1Δ rad52Δ strains was taken from germination plates, pooled at passage 1, and propagated in groups a and b. (B, D, F) Dynamics of ssDNA during senescence, measured for group a at Y′-1000, at Y′-5000, and at YER188W. We called the small sequences in the Y′ subtelomeric repeats situated about 1,000 bp and 5,000 bp from the chromosome ends Y′-1000 and Y′-5000, respectively. Error bars represent the standard deviations (SD) for three measurements. (C, E, G) Average ssDNA calculated for groups a and b at Y′-1000 and at Y′-5000. Error bars represent the SD for six measurements. For group b, the dynamics of ssDNA is presented in Fig. 4 (marked as DPB+). (G) Statistically significant ssDNA values from senescent strains analyzed for panel E were compared to the average ssDNA values from two wild-type strains treated with nocodazole (to avoid the S-phase-specific ssDNA). Similar P values were also obtained for each group.

