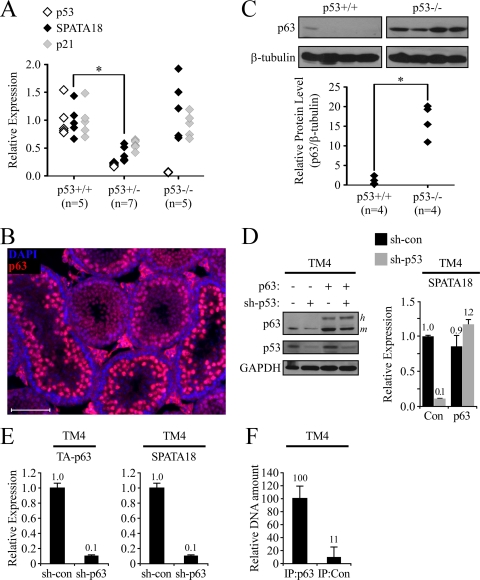
Fig. 4.
SPATA18 transcription is regulated by p53 and p63 in vivo. (A) qRT-PCR analysis was conducted for p53, SPATA18, and p21 mRNA in testes derived from p53+/+, p53+/−, and p53−/− mice. The number of samples in each group is indicated in parentheses. (B) p63 protein was detected by immunofluorescent staining of a testis section from a 25-day-old mouse (red). DNA was visualized with DAPI (blue). (C) p63 protein level was measured by Western blotting of whole-testis lysates derived from either p53+/+ or p53−/− mice. Intensities were quantified using ImageJ software, and relative p63 protein levels were calculated by normalizing to β-tubulin intensities (lower panel). (D) Mouse TM4 Sertoli cells expressing either a control shRNA (sh-con) or an shRNA targeting mouse p53 (sh-p53) were transfected with pCDNA-TA-p63α (p63) or a control vector (Con). Two days after transfection protein levels were determined by Western blotting (left), and expression of SPATA18 was measured by qRT-PCR (right). Of note, the exogenous human p63 (labeled h to the right of the blot) migrated more slowly than the endogenous mouse p63 (m). (E) Mouse TM4 Sertoli cells expressing either a control shRNA or an shRNA targeting mouse p63 were analyzed for the expression of TA-p63 and SPATA18 by qRT-PCR. (F) ChIP analysis of TA-p63α-transfected TM4 cells using p63-specific antibody (IP:p63) or control IgG (IP:Con). The amount of precipitated DNA was measured by qRT-PCR using specific primers designed to amplify a putative p53 binding site in the first intron of mouse SPATA18. Values were normalized to the amount of precipitated nonspecific DNA. Bars represent mean ± standard deviations from two duplicate immunoprecipitants.

