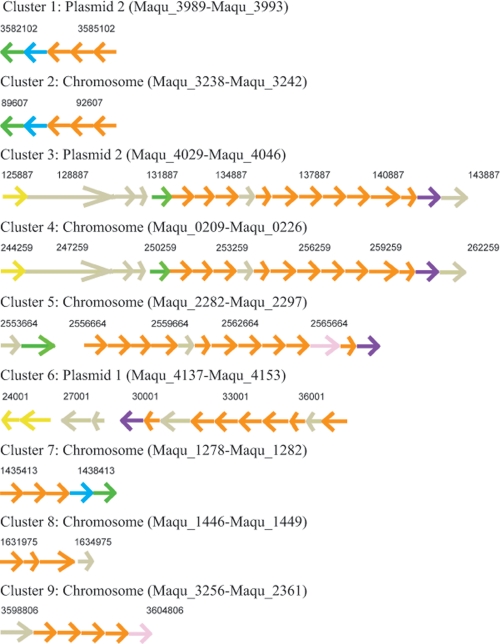
Fig. 3.
Nine putative phosphonate operons. Coloring is determined by COG function classification (orange, inorganic ion transport and metabolism; blue, energy production and conversion; green, transcription; yellow, replication, recombination, and repair; purple, general function prediction only; rose, carbohydrate transport and metabolism; gray, undefined in IMG). Clusters 1 and 2 and clusters 3 and 4 share 99% and 100% similarity, respectively. Clusters 5 and 6 are 50% similar. The sequence of cluster 7 was reversed and aligned with that of cluster 1 but only shared 41% similarity.

