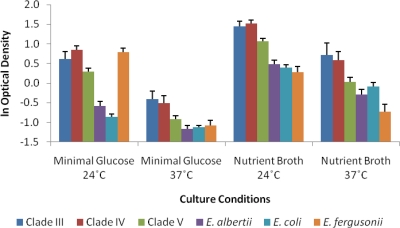
Fig. 1.
Biofilm formation by the six Escherichia clades in rich (L broth) and poor (minimal glucose) media at both 37 and 24°C. The mean optical density readings for each of the Escherichia clades are plotted on a log scale. The optical density readings were used to quantify biofilm formation by measuring the absorbance values for each bacterial culture at 590 nm obtained by extracting the cell bound crystal violet.

