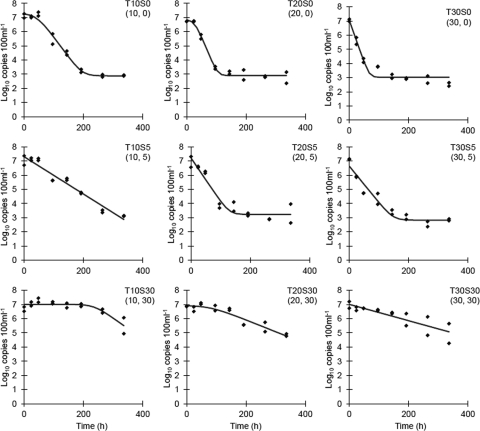
Fig. 1.
Bacteroidales marker decay curves at salinities of 0, 5, and 30‰ at 10, 20, and 30°C, respectively. Temperature (T) and salinity (S) treatment are indicated in the top right of each plot, with temperature indicated first in parentheses, followed by salinity. The lines are the Baranyi-Robert model fit (5).

