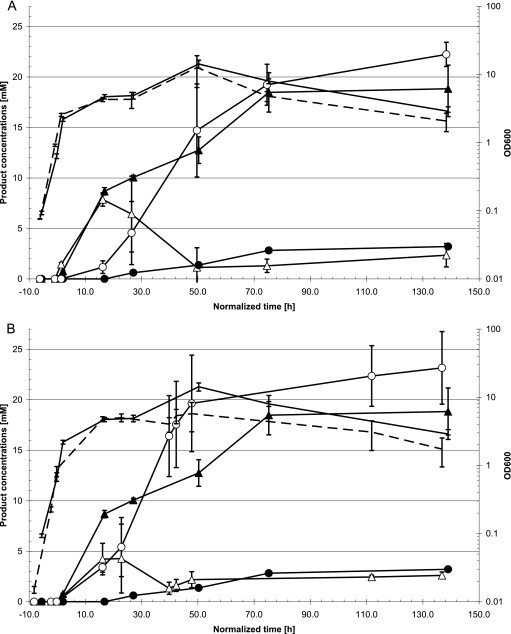
Fig. 1.
Production of acetoin (triangles) and 2,3-BD (circles) during batch fermentations of glucose by transformant strains of C. acetobutylicum. Strain codes: EV (closed symbols in panels A and B), C. acetobutylicum carrying pMTL500E, the empty vector control strain; ADC (open symbols in panel A), C. acetobutylicum carrying pWUR459; THL (open symbols in panel B), C. acetobutylicum carrying pWUR460. Optical densities of the cultures are shown by a solid line (EV) and a broken line (ADC and THL). On the horizontal axis, normalized time is plotted such that 0 h corresponds to an OD600 of 1.0. The control strain did not produce any d-2,3-BD, only meso-2,3-BD. Data represent the mean of triplicate fermentations averaged for each time interval. Error bars indicate standard deviations. OD600, optical density at 600 nm.

