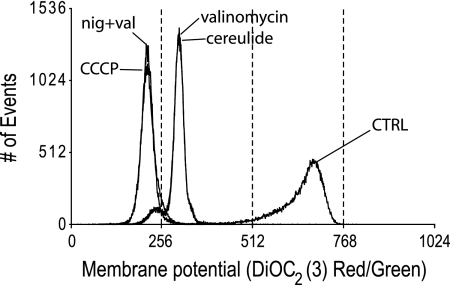
Fig. 5.
FACS DiOC2(3) red/green fluorescence histogram overlays showing the effect of selected compounds on the membrane potential of B. subtilis. Cells were exposed for 5 min to DMSO (CTRL), valinomycin, cereulide, CCCP, and the combination of valinomycin with nigericin. Treated cells are stained for 30 min with 30 μM DiOC2(3) probe.

