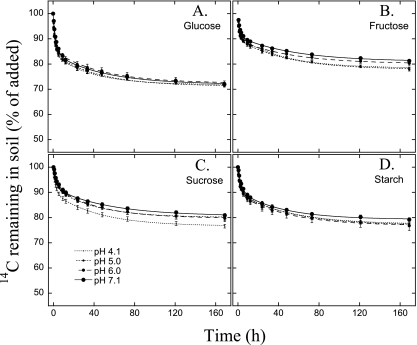
Fig. 2.
Mineralization of sugars. Amounts of 14C-labeled glucose (A), fructose (B), sucrose (C), and starch (D) remaining in soils of the four different pH levels after the injection of the isotopically labeled soil solution into the soil. Values represent means ± 1 SE (n = 3). The lines represent the best fits of double-first-order exponential-decay functions (R2 > 0.99 for all curve fits).

