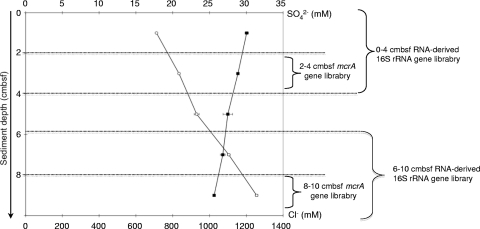
Fig. 2.
Sulfate (■) and chloride (○) pore water concentrations (mean ± the standard deviation) in mM with depth for core CT-21 of the Napoli mud volcano sediments given in cmbsf. The scale represents the sediment depth below the seafloor. Sediment sections dedicated to mcrA- and RNA-derived 16S rRNA are indicated on the right.

