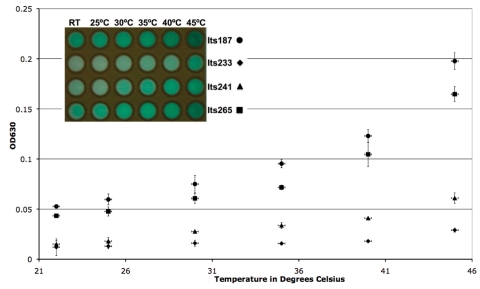
Fig. 2.
Temperature testing of all four LacI(Ts) vectors from 22 to 45°C with X-gal as the LacZ indicator substrate. Each point represents the average (n = 3) spectrophotometric measurement of the insoluble blue precipitate (OD630) at each temperature. Error bars along the x axis represent the temperature variability in the MiniOpticon (0.2°C). Error bars along the y axis represent 1 standard deviation. (Inset) Representative photograph of the LacZ expression responses of the four lacI mutants, showing the increased catalysis of X-gal with increasing temperature.

