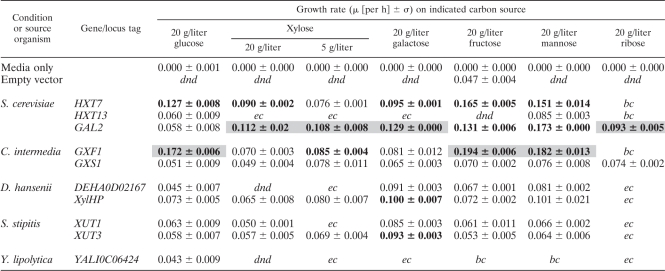
Table 4.
Growth rates conferred by transporter expression in S. cerevisiae EY12a
Here the growth rate (μ) is reported for the 10 genes that conferred growth on any of the carbon sources assayed. Standard deviations are reported, and the genes with significant Z test scores for each carbon source are shown in boldface. The top performer in each category is shaded. Generally, the transporters assayed show a trade-off between efficiency and specificity. There are three abbreviations used to indicate a slow-growth phenotype. The measured growth rate was either below that of the control (bc), indicating detrimental effects on the host, equal to that of the control (ec), showing performance statistically similar to that of the empty vector control, or did not produce a doubling in optical density in 48 h (dnd).

