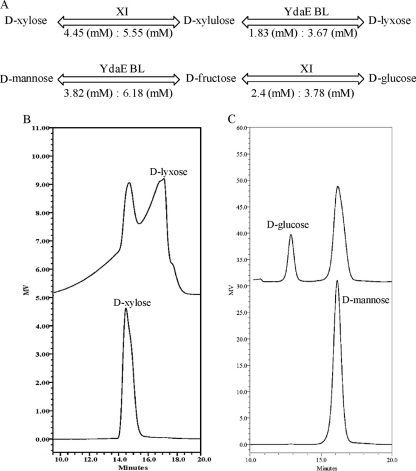
Fig. 5.
Two-step isomerization process carried out by YdaE BL and XI for the production of d-lyxose and d-glucose from d-xylose and d-mannose, respectively. (A) Flow chart showing the saturation level observed at each reaction. At the end, 3.7 mM d-lyxose and 3.8 mM d-mannose were observed. Also shown are HPLC chromatograms of the bioconversion of d-xylose to d-lyxose (B) and d-mannose to d-glucose (C) at the end of the reaction. The retention times of lyxose and xylulose on this column are similar.

