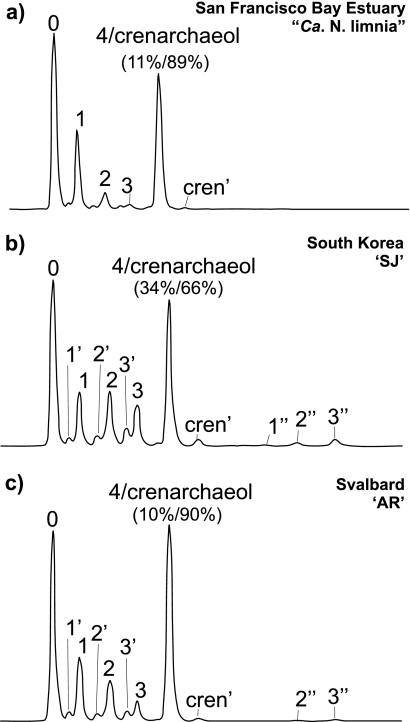
Fig. 2.
Base peak chromatogram of core GDGT profiles of San Francisco Bay enrichment “Ca. Nitrosoarchaeum limnia” (a), coastal South Korea enrichment SJ (b), and coastal Svalbard, Norway, enrichment AR (c). Numbers over peaks correspond to GDGT structures shown in Fig. 1. Numbers with ′ or ″ represent unknown structures with the same m/z as the corresponding GDGT. Percentages listed below peak 4/crenarchaeol indicate the respective contribution of each GDGT to the area of that peak, as corrected according to the method of Hopmans et al. (15).

