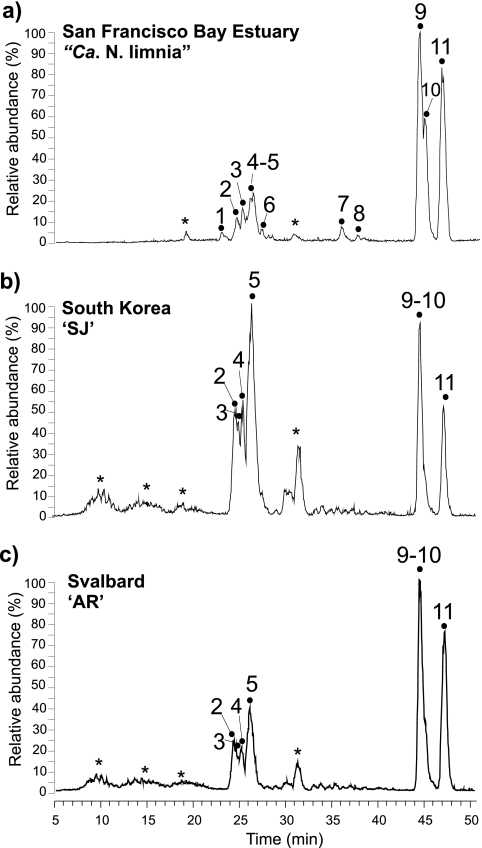
Fig. 3.
Base peak chromatogram of GDGT-based IPL profiles (m/z 1,000 to 2,000) of San Francisco Bay enrichment “Ca. Nitrosoarchaeum limnia” (a), coastal South Korea enrichment SJ (b), and coastal Svalbard, Norway enrichment “AR” (c). Peak numbers correspond to IPL structures described in Table 2. *, nonidentified peak.

