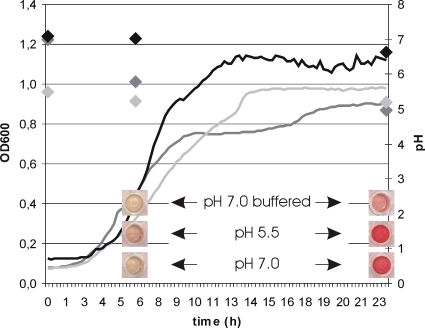
Fig. 2.
Growth curves for an RVH1 splI mutant in LB containing 0.5% glucose with an initial pH of 7.0 (dark gray), 5.5 (light gray), or 7.0 buffered with 100 mM phosphate buffer (black). Measurements of pH (diamonds in corresponding colors) and acetoin production (images below each graph) are shown at the indicated time points. Representative results of three independent experiments are shown.

