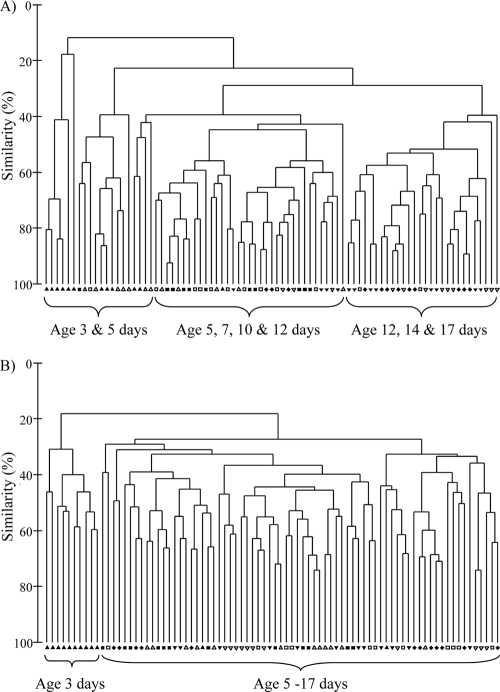
Fig. 1.
Dendrogram representing relationships between T-RFLP profiles of ileal (A) and cecal (B) bacterial communities from individual birds at 3, 5, 7, 10, 12, 14, and 17 days posthatch. All birds were raised on the control diet. ▴, 3 days posthatch; ▵, 5 days; ▪, 7 days; □, 10 days; ▾, 12 days; ▿, 14 days; ⧫, 17 days.

