
Fig. 6.
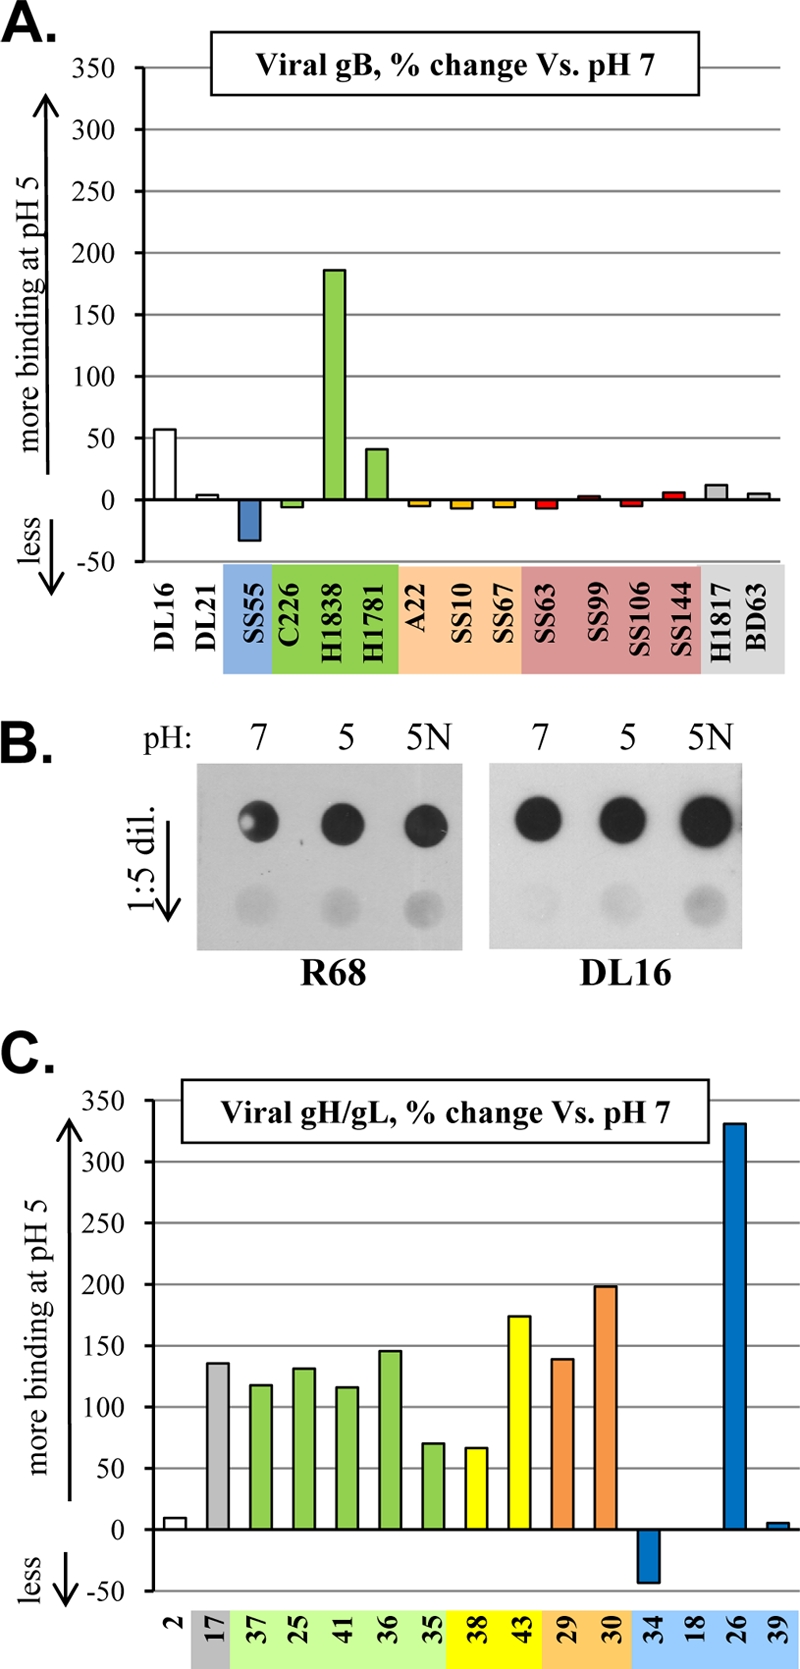
(A) ELISA showing the percent change of MAb binding to various gB epitopes at pH 5 versus pH 7 in the context of virus (HSV-1 KOS). Graph is set up as described in the legend of Fig. 4B. ELISA was repeated twice, and a representative single experiment is shown. (B) Dot blot of HSV-1 virus that was preincubated at either pH 7, 5, or 5N (neutralized from pH 5 to 7). The top dots in each set contain 108 PFU of virus, with the bottom dots showing a 1:5 dilution. The left blot was probed with R68; the right was probed with DL16. (C) ELISA showing the percent change of MAb binding to various gH/gL epitopes at pH 5 versus pH 7 in the context of virus (HSV-2 strain 333). The ELISA was repeated twice, and a representative single experiment is shown.