Fig. 2.
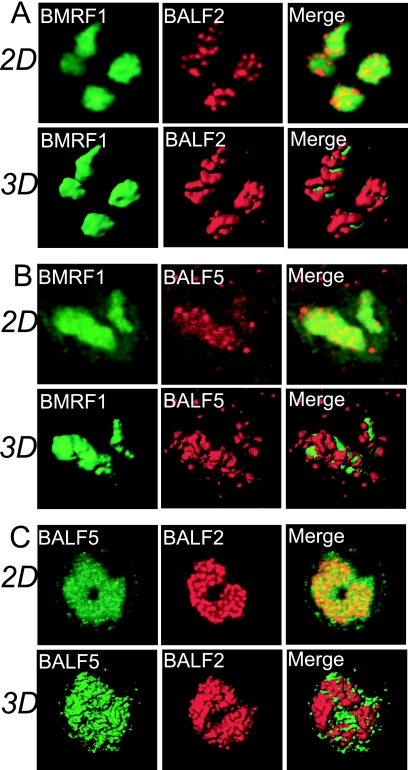
3D surface reconstruction imaging of viral replication compartments. (A) Laser scanning confocal images of BMRF1 and BALF2 proteins. Lytic replication-induced Tet-BZLF1/B95-8 cells were treated with 0.5% mCSK buffer, fixed with 70% ethanol, and stained with anti-BMRF1 (green) and anti-BALF2 (red) antibodies. The 2D images show brightest-point projections of 60 images collected at 0.26-μm steps in the z axis. The same data are displayed as 3D topographical reconstructions of BMRF1 and BALF2 proteins (left and middle panels, respectively). The right panel shows a 3D surface reconstruction image of both proteins showing the BMRF1 core covered by BALF2 proteins. (B) Laser scanning confocal images of BMRF1 (green) and BALF5 (red) proteins. The 2D images show brightest-point projections of 60 images collected at 0.26-μm steps in the z axis. The same data are displayed as 3D topographical reconstructions of BMRF1 and BALF5 proteins (left and middle panels, respectively). The right panel shows a 3D surface reconstruction image of both proteins showing the BMRF1 core covered by BALF5 Pol proteins. (C) Laser scanning confocal images of BALF5 (green) and BALF2 (red) proteins. The 2D images show brightest-point projections of 60 images collected at 0.26-μm steps in the z axis. The same data are displayed as 3D topographical reconstructions of BALF5 and BALF2 proteins (left and middle panels, respectively). The right panel shows a 3D surface reconstruction image of both proteins, showing that the BALF5 Pol proteins and BALF2 proteins are mingled.

