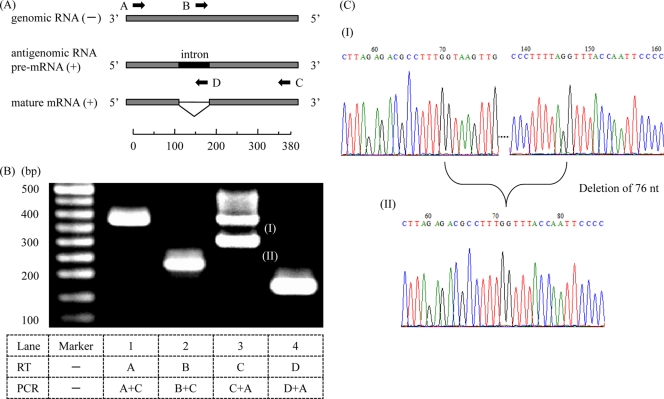
Fig. 5.
Strand-specific RT-PCR analysis for the CTRV L gene transcript. (A) Schematic map of partial regions of CTRV genomic RNA (negative strand; −), antigenomic RNA, and mRNA (positive strand; +) around the intron in the L gene, as shown with a scale bar. The four black arrows indicate the positions and orientations of CTRV gene-specific primers used for strand-specific RT-PCR. For RT, primers A and B anneal specifically to negative-strand RNA, whereas primers C and D anneal specifically to positive-strand RNA, respectively. (B) Agarose gel electrophoresis of the strand-specific RT-PCR products (lanes 1 to 4). The lower table indicates the primers used for each RT and the following PCR. Note that the smallest fragment (II) on lane 3 is an amplified product from spliced mature mRNA with the expected size of 297 bp. (C) Sequence chromatograms of the two PCR products (fragments I and II) in panel B, which were directly sequenced with primer A. The upper chromatogram was obtained from fragment I, and the lower one was obtained from fragment II. Note that the sequence of fragment II contains a deletion of 76 nt, as expected in Fig. 1B.

