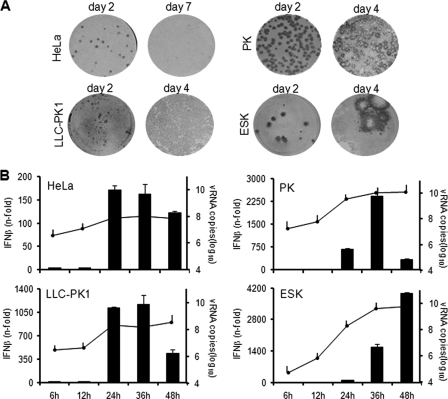
Fig. 3.
Focus formation and IFN activation in other cell lines. (A) HeLa, LLC-PK1, PK, and ESK cells were infected with JEV, and foci were detected by immunostaining at the indicated days postinfection. (B) IFN activation (bar graph) and viral RNA titers (line graph) were measured in JEV-infected cells (MOI, 1) at the indicated times postinfection by real-time quantitative RT-PCR. The results for IFN-β mRNA are expressed as the fold increase over mock-treated cells. The results for JEV RNA are expressed as log10 copies of RNA per 1 μg total RNA. The values were normalized to GAPDH and β-actin for primate and porcine cells, respectively. The error bars indicate standard deviations of the means.

