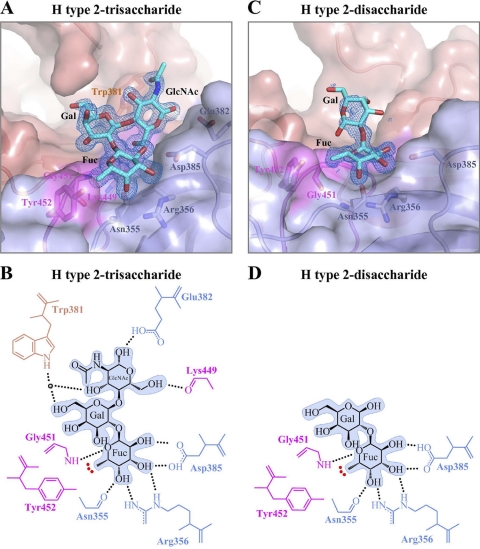
Fig. 3.
GII.10 P domain and H type 2 (trisaccharide and disaccharide) interactions. The H type 2-tri- and -disaccharide binding site is at the same location on the P domain and utilizes identical residues to bind the terminal αfucose1-2 saccharide. (A) Close-up surface and ribbon representation of the GII.10 P domain (colored as described in the legend to Fig. 1B) showing the bound H type 2-trisaccharide (cyan) and electron density map contoured at 1.0 sigma. (B) GII.10 P domain and H type 2-trisaccharide hydrophilic and hydrophobic interactions (colored as described in the legend to Fig. 1B). The HBGA outline was shaded in blue, the black dotted lines represent the hydrogen bonds, the red dotted line represents the hydrophobic interaction from Tyr452, and the sphere represents water molecules. For simplicity, only the backbone was shown for residues that were backbone mediated. Hydrogen bond distances were less than 3.2 Å, though the majority was ∼2.8 Å. (C) Close-up surface and ribbon representation of GII.10 showing the bound H type 2 disaccharide (cyan) and the electron density map at 1.0 sigma. (D) GII.10 P domain and H type 2-disaccharide hydrophilic and hydrophobic interactions.

