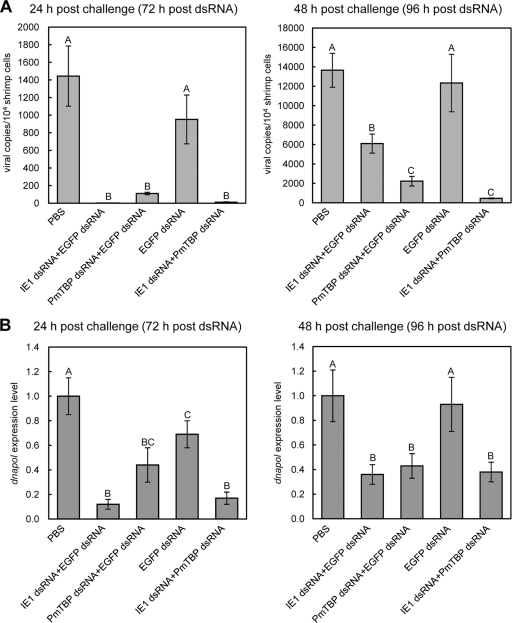
Fig. 9.
Real-time RT-PCR quantification of WSSV loads and dnapol expression levels after pretreatment with ie1 and PmTBP dsRNAs. WSSV copy numbers (A) and EF-1α-normalized WSSV dnapol expression levels (B) were determined for dsRNA-pretreated shrimp 24 and 48 h after WSSV challenge. One sample was taken from each experimental shrimp (n = 4 [or 3] for each group) and quantified in duplicate. Values are means ± SEM. Statistically significant differences are indicated by different letters (A, B, and C) (P < 0.05).

