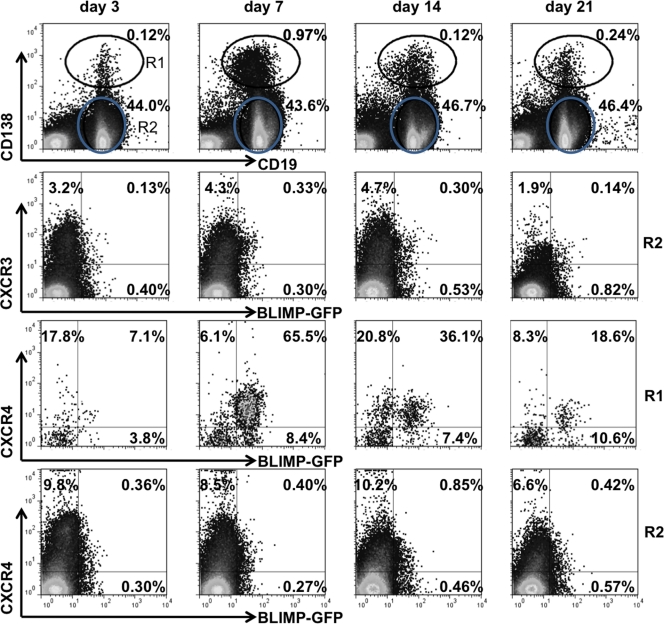
Fig. 2.
CXCR3 and CXCR4 expression on B cells in CLN following virus infection. Cells isolated from CLN of infected BLIMP-1-GFP+/− mice were analyzed for CD19, CD138, GFP, CXCR3, and CXCR4 expression by flow cytometry at the indicated times p.i. Representative plots depict CD138+ CD19lo cells in the R1 region and CD138− CD19+ B cells in the R2 gate with relative percentages (first row), CXCR3 and GFP expression on CD138− CD19+ cells (R2) (second row), and CXCR4 and GFP expression on CD138+ CD19lo cells (R1) and CD138− CD19+ cells (R2) (third and fourth rows, respectively). Numbers in quadrants depict relative percentages in each quadrant. Data are representative of three experiments with pooled CLN from 2 to 4 mice/time point/experiment.

