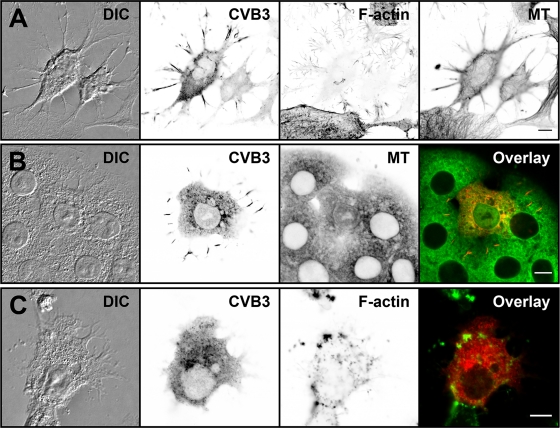
Fig. 6.
Cellular distribution of capsid proteins, microtubules, and actin in transfected cells. (A) Confocal single-cross-section image of cells fixed at 16 h p.t. (B and C) Viral protein localization was studied in the presence of a microtubule-destabilizing drug, nocodazole (B), and an actin-depolymerizing drug, cytochalasin D (C), at 16 h p.t. Transfected cells were first incubated for 8 h in the absence and for 8 h in the presence of drugs. The cells were stained for capsids with CVB3 Ab, followed by Alexa 488-conjugated anti-rabbit IgG (red). Actin and microtubules were visualized by TRITC-phalloidin (green) and α-tubulin MAb, respectively, followed by Alexa 633-conjugated anti-mouse IgG (green). Differential interference contrast (DIC) and inverted gray scale images are shown. Scale bars, 10 μm.

