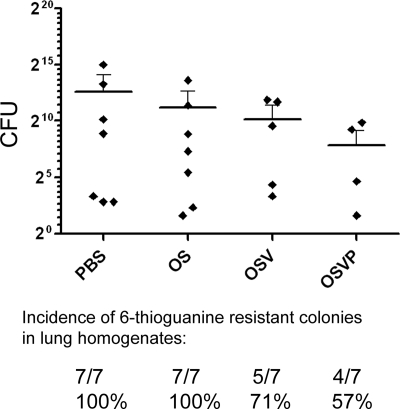
Fig. 5.
Quantification of pulmonary metastases. Virus-treated mice bearing 4T1 tumors were sacrificed 30 days post-tumor inoculation, and both lungs were harvested from each treated mouse and homogenized for cell culture. Clonogenic metastatic foci derived from total lung homogenates were enumerated by limited dilution culture in the presence of 6-thioguanine. Individual resistant colonies were counted and used to determine the number of CFU per animal (x axis). Shown are the calculated CFU of each mouse sorted by treatment. Means for each treatment group are represented by horizontal bars with error bars delineating 95% CI. The mean number of metastatic colonies recovered from the OSVP-treated group was significantly less than that of the PBS control group (Mann-Whitney test; P = 0.0474), but other pairwise comparisons did not prove statistically significant. The results shown are from one of three independent experiments that produced similar results. Not all samples yielded colonies, and the ability to recover colonies was used to determine pulmonary metastasis incidence rates for each group (shown below the chart).

