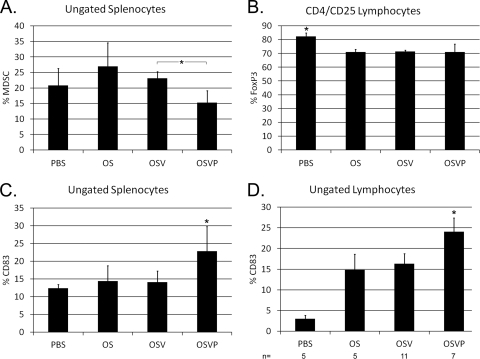
Fig. 6.
Immunophenotypes of draining lymph node lymphocytes and splenocytes. 4T1 tumor-bearing mice with similarly sized and well-developed tumors were given a single intratumoral injection of the indicated viruses. After 2 days, cells from draining lymph nodes (B and D) or spleens (A and C) were isolated and analyzed for MDSC markers (Gr1+, CD11b+) (A), CD4+CD25+FoxP3+ regulatory T cells (B), and CD83 (C and D). Indicated phenotypes are shown as the mean percentage of total live cells interrogated by flow cytometry (error bars represent 95% CI of the means) (n = 3 unless otherwise noted). Asterisks with brackets indicate pairwise statistical significance. Asterisks alone indicate statistical significance over all pairwise comparisons among the treatments (two-tailed t test; P < 0.05).

