Fig. 4.
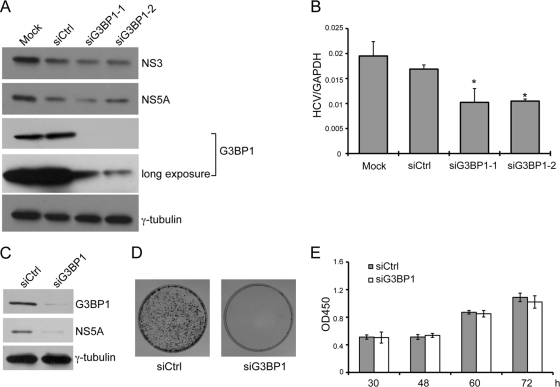
Knockdown of G3BP1 reduces HCV subgenomic replicon RNA replication. (A and B) Replicon cells were left untransfected (Mock) or were transfected with an siRNA duplex targeting G3BP1 or control siRNA as indicated at a final concentration of 50 nM. After 48 h, the cells were harvested with SDS loading buffer for Western blot analysis (A) or with Trizol reagent for RNA extraction (B). (A) Western blot analysis is shown, using the antibodies indicated to the right. (B) RNA levels were measured by quantitative RT-PCR. HCV RNA levels were normalized to levels of GAPDH RNA. Mean HCV RNA values from triplicate wells are shown. Error bars indicate the standard deviation; asterisks indicate values different from the Mock value (Student's t test, *, P < 0.05). Similar results were obtained in two additional independent experiments. (C to E) Huh7 cells were transfected with siG3BP1-1 (siG3BP1) or control siRNA (siCtrl) as indicated at a final concentration of 50 nM. (C and D) Twenty-four hours later, the cells were electroporated with 10 μg of HCV replicon (S2204I bsd) RNA. (C) At 1 day postelectroporation, equal portions of the cells were analyzed by Western blotting, using the antibodies indicated to the right; γ-tubulin serves as a loading control. (D) The remaining cells were grown in conditioned media supplemented with 20 μg/ml of blasticidin for about 1 month, and colonies were visualized by crystal violet staining. (E) The effect of G3BP1 silencing on Huh7 cell growth was examined. After transfection with the indicated siRNAs, the relative cell number (OD450) was determined at the indicated time points using the Cell Counting Kit-8. For panels C to E, similar results were obtained in at least one additional independent experiment.

