Fig. 5.
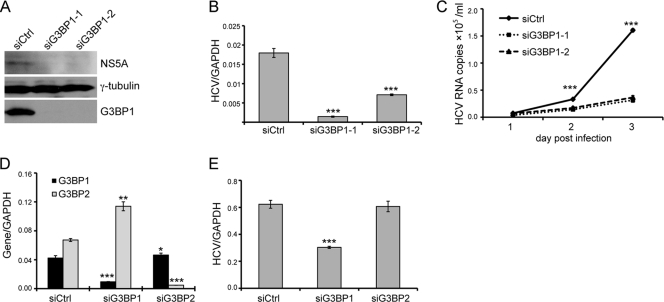
Knockdown of G3BP1 reduces HCVcc infection. (A to C) Huh-7.5 cells were transfected with the indicated siRNAs targeting G3BP1 or control siRNA at a final concentration of 50 nM. After 24 h, the siRNA-treated Huh-7.5 cells were inoculated with JFH1 HCVcc at a multiplicity of infection of 0.1. Culture supernatants were harvested daily until 3 days postinfection; infected cells were harvested at 3 days postinfection. (A) Western blot analysis of cells harvested 3 days after JFH1 infection. The antibodies used are indicated to the right; γ-tubulin serves as a loading control. (B) Intracellular RNA levels 3 days postinfection were quantified by quantitative RT-PCR. Mean HCV RNA levels normalized to the level of GAPDH RNA from triplicate wells are shown; error bars indicate the standard deviation. (C) Levels of HCV RNA in the culture media were determined at the indicated times by quantitative RT-PCR. (D and E) Huh-7.5 cells were transfected with siG3BP1-1 (siG3BP1), siG3BP2, or control siRNA (siCtrl) as indicated at a final concentration of 50 nM. (D) Silencing efficiency was measured after 2 days by quantitative RT-PCR using primers specific for G3BP1 and G3BP2. The level of G3BP1 or G3BP2 RNA was normalized to the level of GAPDH RNA. Mean normalized values from triplicate samples are plotted; error bars indicate the standard deviation. (E) Huh-7.5 cells treated with the indicated siRNAs were inoculated 24 h later with JFH1 HCVcc. RNA was harvested 48 h after infection, and the amount of HCV RNA was determined by quantitative RT-PCR. Mean HCV RNA levels from triplicate samples, normalized for GAPDH level, are plotted; error bars indicate the standard deviation. Asterisks indicate significant differences from the control (siCtrl, Student's t test; *, P < 0.05; **, P < 0.01; ***, P < 0.001). Similar results were obtained in two additional independent experiments.

