Fig. 6.
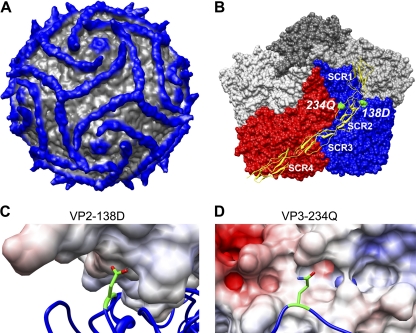
Critical capsid residues are in contact with DAF. (A) Cryo-EM reconstruction of DAF bound to CVB3-RD at 9-Å resolution displayed at 1 sigma. Density further than 160 Å from the center of the virus is shown in blue. (B) Surface representation of CVB3-RD protomers surrounding one 5-fold icosahedral axis of the virus with DAF shown in yellow ribbon. The DAF molecule attaches at the 3-fold vertex by way of the C-terminal His tag; SCRs 4 and 3 stretch across the virus surface of the red protomer (in standard orientation), crossing the canyon, and SCR2 interacts with the puff region of the blue (neighboring) protomer. SCR1 makes no contacts, rising above the virus surface. Residues VP2-138D and VP3-234Q are highlighted in green. (C) Close-up view of residue VP2-138D (in green, stick rendering) with DAF colored according to electrostatic potential. The light blue coloring of DAF indicates an overall slightly positive charge in the region nearest to VP2-138D. (D) Close-up view of residue VP3-234Q (in green, stick rendering with oxygen and nitrogen colored red and blue, respectively) with DAF surface rendered and colored according to electrostatic potential; the side chain configuration shown is derived from the crystal structure of CB3-RD and may differ in virus-DAF complex. The light-red coloring of DAF indicates a negative charge in the region nearest to VP2-234Q.

