Figure 1.
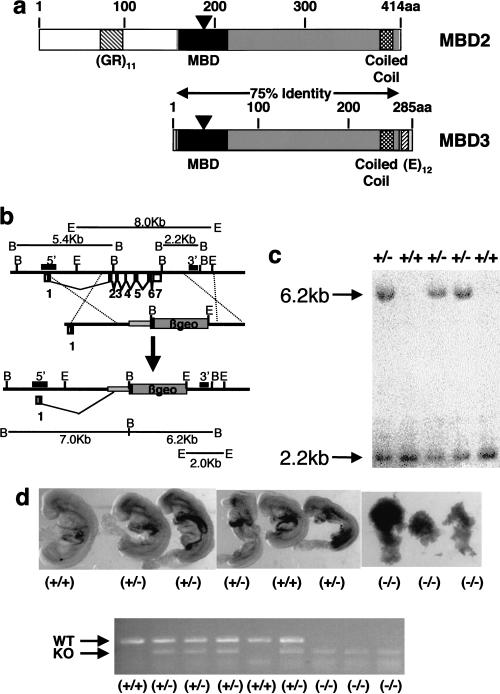
Targeted deletion of Mbd3. (a) Schematic diagrams of the MBD2 and MBD3 proteins. Amino acids to the right of the black triangles are not encoded by the targeted alleles. The portion shown in dark gray is 75% identical at the amino-acid level between the two proteins. The methyl-CpG–binding domains are shown as black boxes, the putative coiled-coil domains are shown as stippled boxes, and the simple sequence repeats are shown as cross-hatched boxes. (b) The exons of the Mbd3 gene are indicated below the line with coding sequences indicated as black-filled boxes. Exons 2–7 were replaced by the βgeo cassette to generate the targeted allele. Probes used in Southern blots are indicated as hatched boxes above the line labeled either 5′ or 3′, and restriction fragments used for genotyping are indicated. (B) BglII, (E) EcoRI. (c) Southern blot of BglII digested DNA derived from five mice probed with the 3′ probe indicated in part a. Genotypes of the mice are indicated at the top. (d) 8.5 d.p.c. embryos from a single litter are shown at the top, with genotypes determined by the PCR results shown below. The order of embryos is the same as that for the PCR. The top band of the PCR is derived from the wild-type allele, whereas the lower band is derived from the targeted allele. Primers are visible at the bottom of the gel.

