Fig. 5.
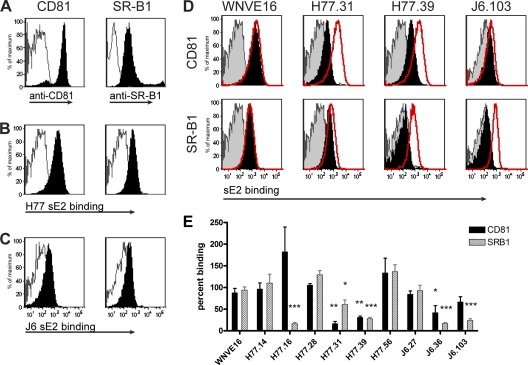
Inhibition of sE2 binding to CD81 and SR-B1 by neutralizing MAbs. (A) Verification of ectopic CD81 and SR-B1 receptor expression on CHO cells. CHO-CD81 or CHO–SR-B1 cells were incubated with either mouse anti-hCD81 or rabbit-anti-hSR-B1 (black histograms) or an irrelevant MAb (unfilled gray histograms) for 30 min on ice. The cells were washed, incubated with the appropriate secondary antibodies, and processed by flow cytometry. (B and C) Binding of genotype 1a (H77) E2 (B) or genotype 2a (J6) E2 (C) to CHO-CD81 and CHO–SR-B1, but not wild-type (WT) CHO cells. CHO-CD81 or CHO–SR-B1 (solid black histograms) or WT CHO (unfilled gray histograms) cells were incubated with sE2, and binding was assayed by flow cytometry. The data are representative of at least three independent experiments. (D) Assessment of inhibition of sE2 binding to CHO-CD81 or CHO–SR-B1 cells by neutralizing MAbs. sE2 was preincubated with neutralizing MAbs and added to CHO cells, and binding was detected by flow cytometry. Examples of MAbs that inhibit sE2 binding to CD81 preferentially (H77.31), to both CD81 and SR-B1 (H77.39), or only to SR-B1 (J6.103), as well as a negative-control MAb (WNV E16), are shown. The histograms are representative of three individual experiments. The solid black histograms represent sE2 binding in the presence of MAb, the red histograms represent sE2 binding in the absence of MAb, and the shaded gray histograms represent sE2 binding to CHO WT cells. (E) Graphical representation of sE2 binding to CHO-CD81 and CHO–SR-B1 cells in the presence of neutralizing MAbs. The values were determined by dividing the fluorescence quotient (mean fluorescence intensity × percent positive cells) for E2 binding in the presence of a neutralizing MAb by the fluorescence quotient of sE2 binding to either CHO-CD81 or CHO–SR-B1 cells alone. The asterisks represent statistically significant differences in sE2 binding compared to the negative-control MAb, WNV E16: *, P < 0.05; **, P < 0.01; and ***, P < 0.001. The error bars represent the standard errors of the mean. The data are pooled from three independent experiments.

