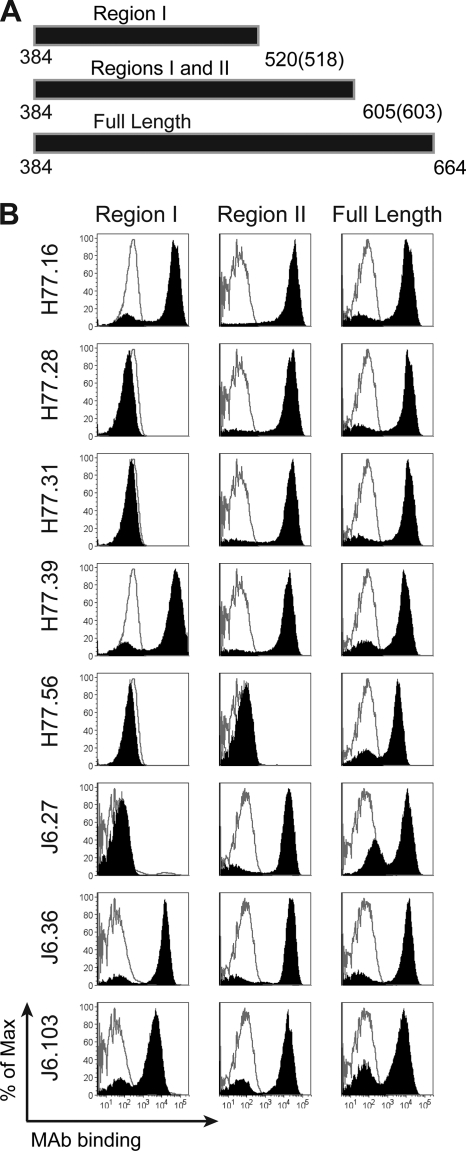
Fig. 6.
Mapping of anti-E2 antibodies using COOH-terminal truncation mutants. (A) Scheme of E2 truncations used for mapping. cDNA containing region I (aa 384 to 520 and aa 384 to 518 in E2 of genotypes 1a and 2a, respectively) or I and II (aa 384 to 605 and 384 to 603 in E2 of genotypes 1a and 2a, respectively) and the full-length ectodomain (aa 384 to 664) were displayed on the surface of yeast. (B) MAb supernatants were incubated with yeast and assessed for binding by flow cytometry. Neutralizing MAbs binding to regions I (H77.16, H77.39, J6.36, and J6.103) and II (H77.28, H77.31, and J6.27) and the full-length E2 ectodomain (H77.56) are shown. The solid black histograms depict binding of HCV-specific MAbs, and the gray unfilled histograms represent binding of a negative-control MAb (WNV E16). The histograms are representative of three independent experiments.

