Fig. 7.
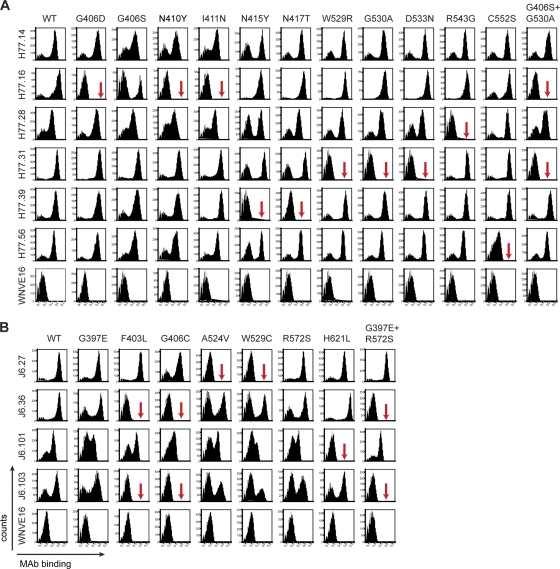
Epitope localization of anti-HCV MAbs. Binding of neutralizing MAbs to yeast expressing E2 protein variants. (A) Flow cytometry histograms of wild-type and loss-of-binding genotype 1a E2 variants (G406D, G406S, N410Y, I411N, N415Y, N417T, W529R, G530A, D533N, R543G, C552S, and G406S plus G530A). Representative histograms are shown for the MAbs H77.14, H77.16, H77.28, H77.31, H77.39, H77.56, and WNV E16 (negative control) with WT H77 E2 and each of the variants. The data shown are representative of three independent experiments. The red arrows indicate >80% loss of binding of a specific MAb for a given variant. (B) Flow cytometry histograms of wild-type and loss-of-function genotype 2a E2 variants (G397E, F403L, G406C, A524V, W529C, R572S, H621L, and G397E plus R572S) with individual neutralizing MAbs. Representative histograms are shown for the MAbs J6.27, J6.36, J6.101, J6.103, and WNV E16 (negative control) with the wild-type E2 and each of the variants. The data shown are representative of three independent experiments. The arrows indicate >80% loss of binding of a specific MAb for a given variant.

