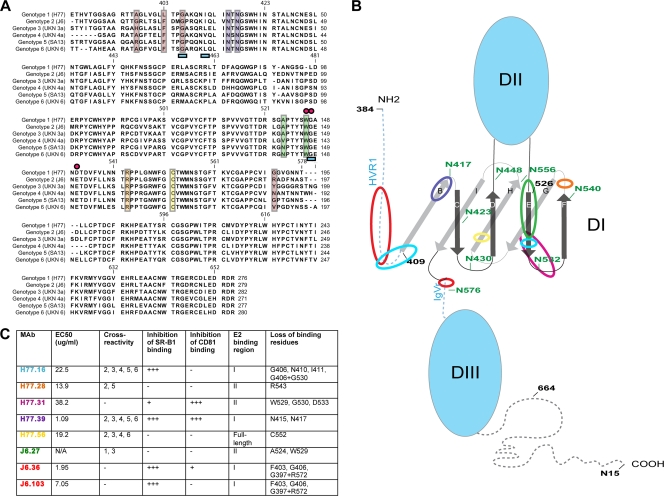
Fig. 8.
Localization of MAb binding residues on E2. (A) Alignment of E2 sequences from HCV genotypes 1 to 6 with superimposed mapping of MAb binding residues. The sequences of E2 from strains representative of the different genotypes (genotype 1a, H77; genotype 2a, J6; genotype 3a, UKN 3; genotype 4a, UKN 4a; genotype 5a, SA513; genotype 6a, UKN 6) used in the yeast-mapping studies (Fig. 2) were aligned. Colored boxes and symbols were used to highlight neutralizing MAb binding residues as follows: red boxes, J6.36 and J6.103; purple boxes, H77.39; blue underscoring, H77.16; green boxes, J6.27; pink circles, H77.31; orange box, H77.28; yellow box, H77.56. (B) Putative model of the structure of the E2 protein with MAb binding regions highlighted. A scheme depicting a possible E2 structure was adapted from Krey et al. (36) to highlight regions involved in MAb recognition. N-linked glycosylation residues are labeled in green, and amino acids are numbered in black at intervals; β-sheets in D1 are labeled as previously described (36). MAb binding regions are highlighted with colored circles as follows: red circles, J6.36 and J6.103; purple circle, H77.39; light-blue circles, H77.16; green circle, J6.27; pink circle, H77.31; orange circle, H77.28; yellow circle, H77.56. (C) Summary of neutralizing MAbs described in this study. EC50 values (neutralization against homologous virus), cross-reactivity to E2 from different genotypes, inhibition of binding to CD81 and SR-B1, reactivity with different regions of E2, and loss-of-binding residues are listed. MAb names are color coded to correspond to panels A and B.

