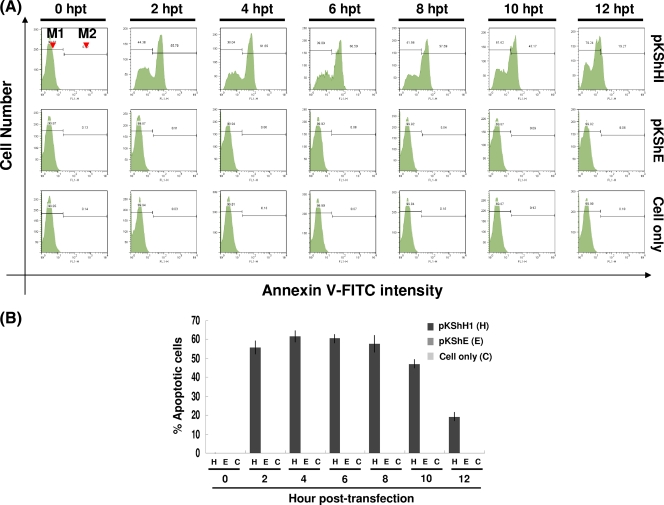
Fig. 2.
Assessment of apoptosis resulting from hhi1 transfection in Sf-21 cells by annexin V assay. (A) Representative histograms of flow cytometry analysis showing the fluorescence intensity of annexin V-labeled apoptotic cells transfected with pKShH1 or pKShE. The annexin V-positive cells can be identified in the M2 region. M1, nonapoptotic cells; M2, apoptotic cells. (B) Bar graph showing the percentage of apoptotic cells at different time points posttransfection resulting from annexin V labeling.

